mpl_bsic.apply_bsic_style#
- mpl_bsic.apply_bsic_style(fig, ax, sources='BSIC')[source]#
Apply the BSIC Style to an existing matplotlib plot.
You can call this function at any point in your code, the BSIC style will be applied regardless. Before saving, however, make sure you do
plt.show()so that the style gets applied to the plot. This function works by adding an animation such that, regardless of where you specify your title, it will be updated with the correct style.First, the function will set the correct fontsizes and font family for the plot text (labels, ticks…).
It will also set the color cycle used in matplotlib to the colors specified in the BSIC design standards. If you already plotted, it will, again, change the colors of the lines to the correct ones.
The function will make sure that, whenever you update the title of the plot, it gets drawn with the correct style.
Additionally, it will display the sources specified in the parameter at the bottom of the figure. It will always add BSIC as a source.
Warning
You have to make sure you always call
plt.show(), even if you just want to export the figure. This makes sure that the animation is performed and the correct style is applied to the title.- Parameters:
- fig
matplotlib.figure.Figure Matplotlib Figure instance.
- ax
matplotlib.axes.Axes Matplotlib Axes instance.
- sources
str|list[str], optional List of sources, by default “BSIC”. You can either specify a string (if you have only one source) or a list of strings (multiple sources).
Since BSIC is always a source, it will always be included.
NB: if when calling
plt.show()the text seems cutted out, don’t worry. When exporting usingbbox_inches="tight", it will seamlessly fit within the figure. This happens because I want to make sure there is enough space between the plot and the sources text, so I position the text at the very bottom of the figure.
- fig
See also
mpl_bsic.apply_bsic_logoApplies the BSIC Logo to plots.
Examples
from mpl_bsic import apply_bsic_style

x = np.linspace(0, 5, 100)
y = np.cos(x)

fig, ax = plt.subplots(1, 1)
ax.set_title('Cos(x)') # set the title before applying the style
# the function will re-set the title with the correct style
apply_bsic_style(fig, ax)

ax.plot(x,y)
(
Source code,png,pdf)
Plotting sources is as easy as specifying the parameter.
from mpl_bsic import apply_bsic_style

x = np.linspace(0, 5, 100)
y = np.cos(x)

fig, ax = plt.subplots(1, 1)
ax.set_title('Cos(x)') # set the title before applying the style
# the function will re-set the title with the correct style
apply_bsic_style(fig, ax, sources=['Bloomberg', 'FactSet'])

ax.plot(x,y)
(
Source code,png,pdf)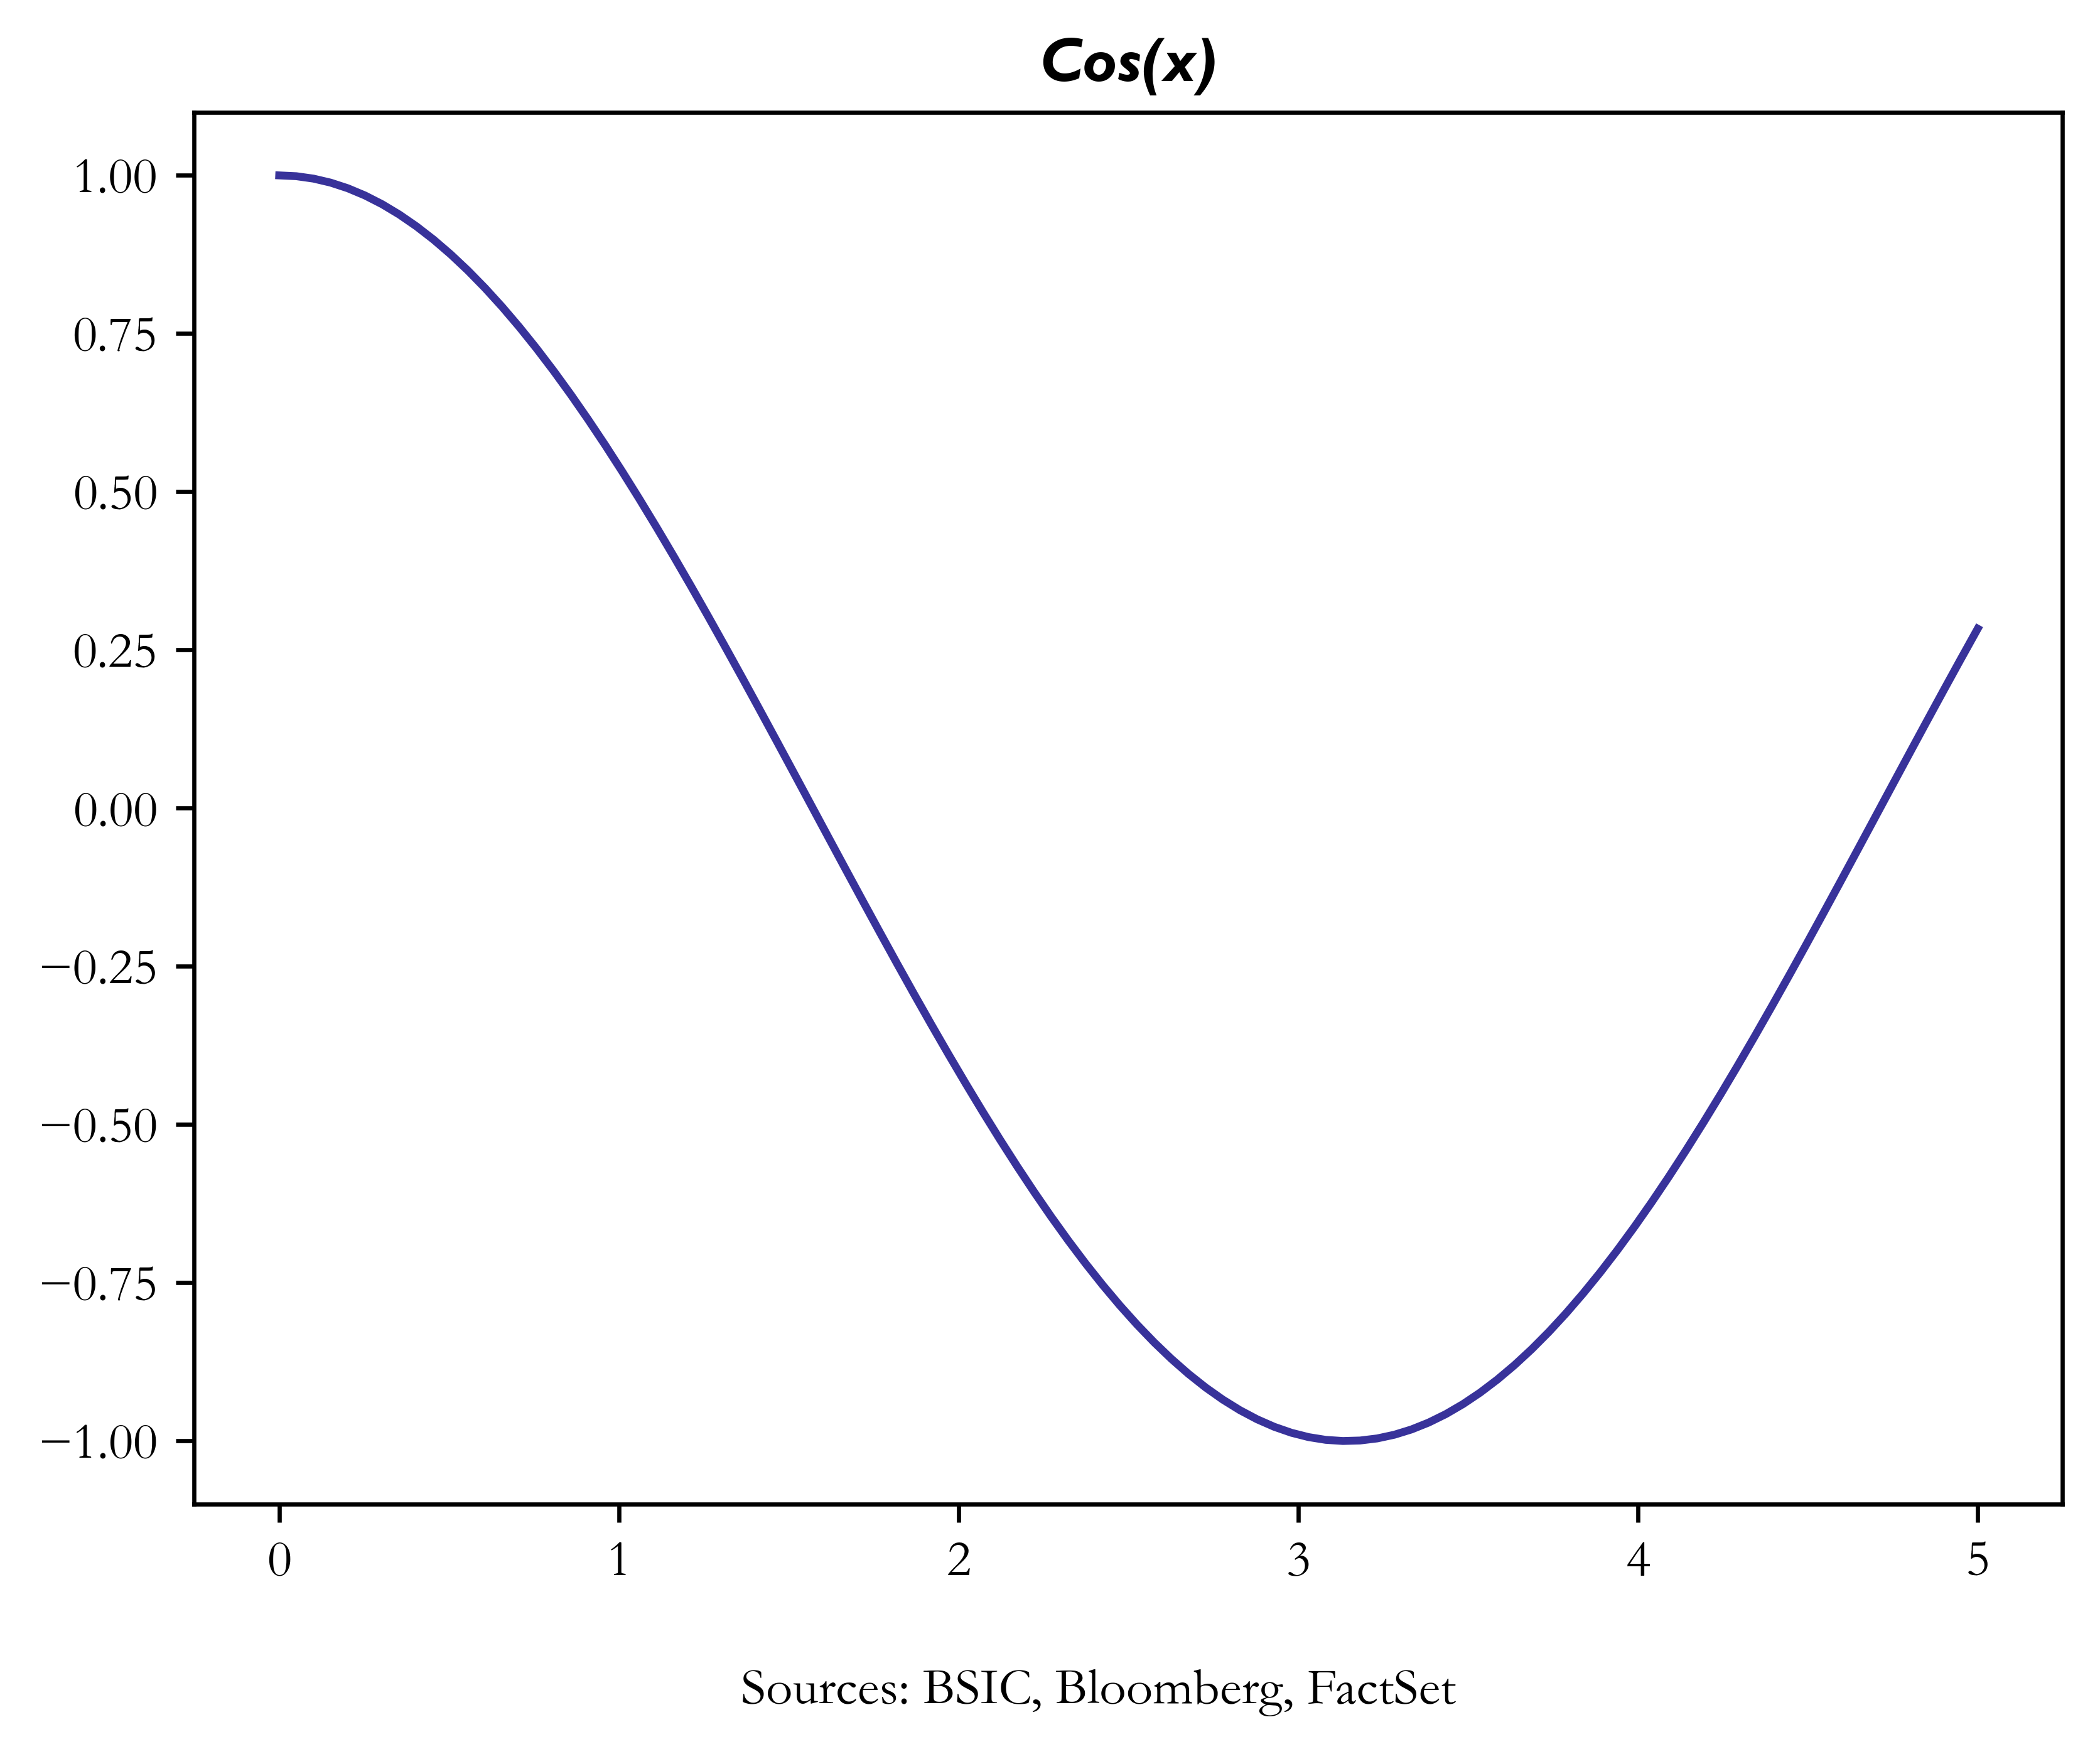